New York’s transportation system was one of the victims of Hurricane Sandy – one of the costliest and most destructive hurricanes in U.S. history – flooding several subway tunnels and shutting down many train and bus stations across the city. Damages were estimated at over $40 billion, with hundreds of thousands of homes being destroyed, and traffic being disrupted for almost a week. But, the fact that evacuation efforts went on virtually without a hitch prompted researchers at the University of Illinois to analyze New York’s transport system and try and figure out what made it bounce back so quickly, so that they can help local authorities determine how resilient their transportation systems are to extreme weather conditions.
They used GPS data from New York taxis in order to determine how the city’s traffic patterns changed during hurricanes, snowstorms, and other extreme events. Dan Work, an assistant professor in the Department of Civil and Environmental Engineering (CEE) and Brian Donovan, a graduate student in CEE’s Sustainable and Resilient Infrastructure Systems program have created a new method for computing the distributions of travel times between different parts of a city and measuring how much the pace of taxi trips deviated during hurricanes. The researchers analyzed 700 million taxi trips made over the course of four years before and after Hurricane Sandy, and found that traffic in New York was brought back to normal relatively quickly.
“The first step was to figure out from the data what is normal,” Work said. “There is a heartbeat pattern to the city every single day. In the middle of the night when traffic is light, you can get from one side of the city to another very quickly, and every morning during rush hour the roads are congested. The data shows us the typical heartbeat, and then we look for the arrhythmia.“
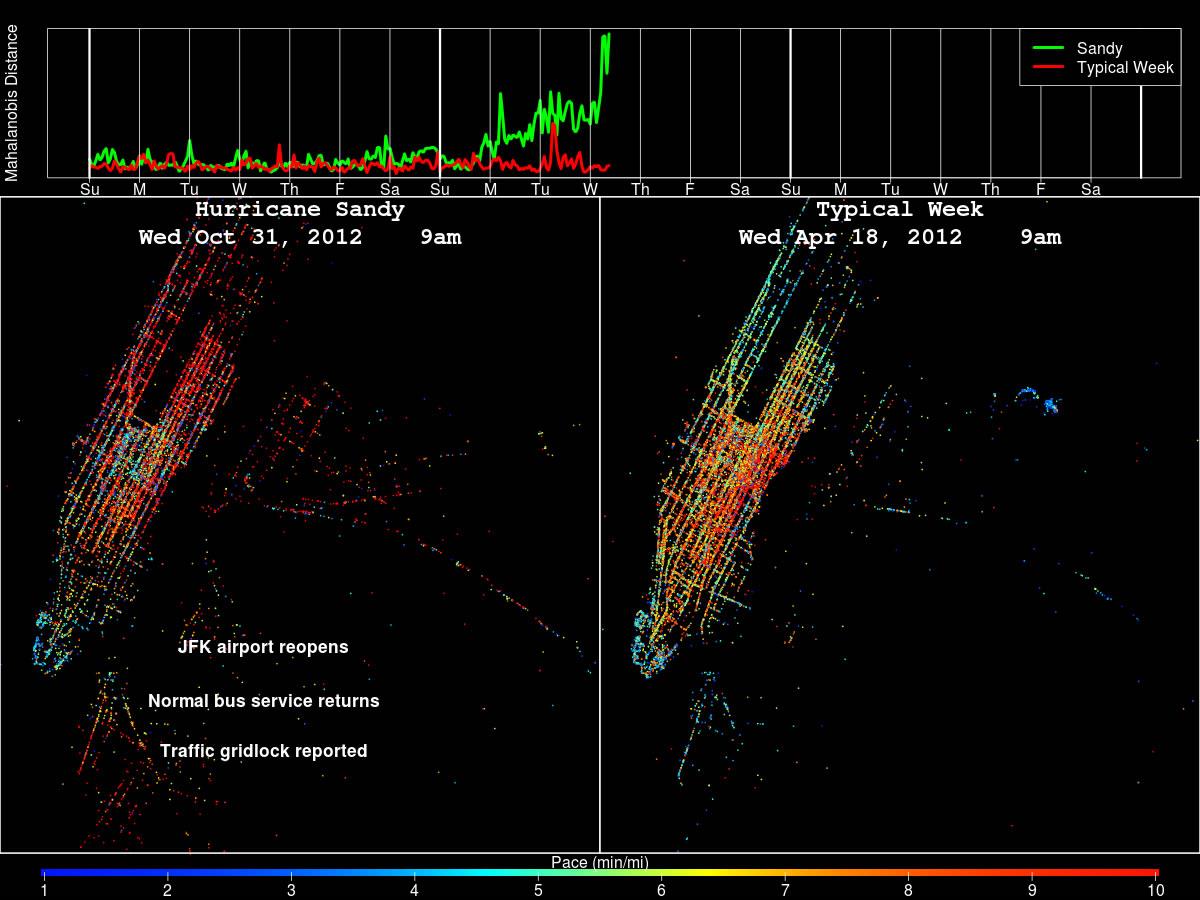
Work and Donovan created a visualization of GPS data from New York taxis in the days immediately after the hurricane, comparing it against a visualization of the same type of data from days when traffic conditions where normal, and found that the longest traffic delays took place when residents got back to the city a couple of days after the storm. Work said that this finding, although a bit surprising, helped them realize that the process of bringing people back to their homes equally as important as the evacuation process so that emergency crews don’t get stuck in traffic while trying to do their job.
Unlike other traffic monitoring methods, that employ sensors and video cameras, the researchers asked New York City Taxi and Limousine Commission to provide them with taxi data they needed, and the commission had to grant their request under the Freedom of Information Law.